BCoT Maths
  • Home
  • FAQ
  • Trivia

What are stem and leaf diagrams?


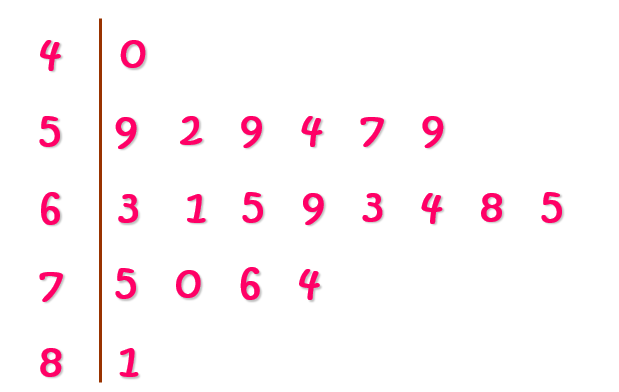
A stem and leaf diagram is named due to the way it is drawn. A stem refers to the 'tens' and leaves refer to the 'ones' or 'units' and is a great way to organise a long list of numbers. Stem and leaf diagrams are part of the statistics family but they may not be mentioned explicitly, they may be hidden in 'displaying data', 'data handling' or 'types of data'. 

Drawing a stem and leaf diagram


Step 1: Draw a vertical line which has enough room to fit numbers either side of it.
Step 2: Put all of your 'tens' on the left hand side of the line but only put the first digit (for example: for 41, write 4) 
Step 3: Put the 'ones' or 'units' on the right hand side next to their accompanying 'tens' (for example 4 | 1)
Step 4: Make sure all of the numbers are in numerical order.
Step 5: Draw a key to represent the data and how it is being shown. 

​The video to the right guides you on how to draw a stem and leaf diagram. 

Completing a stem and leaf diagram


Here are the marks gained by 20 students in an examination: 63  59  61  52  59  65  69  75  70  54  57  63  76  81  64  68  59  40  65  74
Display this data as a stem and leaf diagram.
Step 1: Draw your vertical line which represents the split between the two numbers.
Step 2: Write the tens figures in the left hand column of the line (4, 5, 6, 7, 8) 
[Optional] Step 3: Reorder the numbers above so they are in numerical order (makes it easier but not necessary)
Step 4: Go through the marks in turn and put in the units figures of each mark in the appropriate row. 
Step 5: When the diagram is complete, it should look like the one below. 
Picture
You can also watch the video below for a step by step guide on completing the stem and leaf diagram.

Stem and leaf diagrams with mode, median and range


Later on in the paper, you may be asked to work out the mode, median and range in the data displayed in the stem and leaf diagram. 
  • To work out the mode, focus on the most common number that appears (mode = most common). In the example above, the most common is 59.
  • To work out the median, you have to work out the middle number when the stem and leaf diagram is ordered (this is why it is important to make sure they're in numerical order!). To do this, cross off the numbers of either side. In our case, you should be left with 63 and 64, however, you cannot have two medians so the middle number is 63.5 which is our median. 
  • To work out the range, take away the highest number from the lowest number. In our case, this is 81 subtract 40 which gives us 41.
Tutorial on solving the mode, median and range within a stem and leaf.
Further resources
Grade 2 - Stem and Leaf past paper
Grade 2 - Stem and Leaf past paper answers
Powered by Create your own unique website with customizable templates.
  • Home
  • FAQ
  • Trivia