BCoT Maths
  • Home
  • FAQ
  • Trivia

What is a frequency polygon?


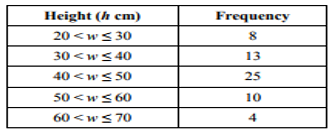
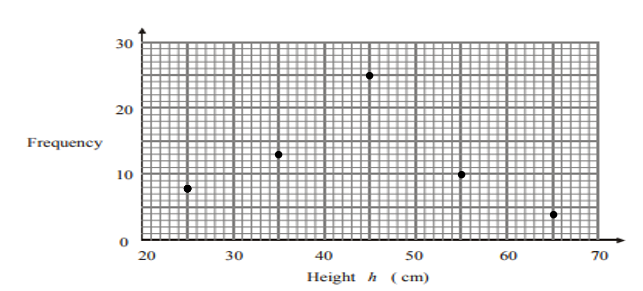
A frequency polygon appears in one of those questions that seem to be way more complicated than it actually is. There tends to be some data with these kind of signs ><>< and there's another frequency column and underneath there's a graph and you're supposed to somehow plot the frequency polygon. It looks a lot harder than it is and on this page, I'll explain how you would work them out and plot them correctly in the exam.

How do I work out how to plot a frequency polygon?


Picture
During your time studying for your GCSE exam, there will be that one lesson where your teacher will start going on about midpoints. This is that lesson. Frequency polygons are all about finding the midpoint but if you're like me, you don't really remember what you need to find the midpoint of. 

When you turn the page and see this table, you might sigh in frustration... but don't, because midpoints. The first column is where you hunt for the midpoint then you don't need to worry about midpoints again. If you take the table above as an example, the first row says 20 < w < 30 which is just unnecessarily confusing. To find out what you need to actually plot, you just need to find the midpoint which is as simple as: what is the number in between 20 and 30? 25. 

If you do this all the way down, you will find that you have the midpoints of 25, 35, 45, 55 and 65 which is a lot easier to plot than whatever 30 < w < 40 is meant to be. You can even create your own midpoint column where you can put your newly found midpoints in. 

Plotting your midpoints


It's time... to plot... your midpoints​! So you have your midpoints (and your teacher is very proud) and you have your frequency, now all you need to do is take those 2 numbers and plot them on the graph provided. You will plot your midpoints starting from along the bottom. 

Your first midpoint is 25, so make sure you find the line that is in between 20 and 30, you'll need to then go up the y-axis to find the frequency to plot your first point. Keep doing this and you'll make a pattern.

This is the graph that does not need to be a straight line. However, you will still need to use a ruler to join the plots. 
Picture
Powered by Create your own unique website with customizable templates.
  • Home
  • FAQ
  • Trivia